 Edited by
Short answer
To read an AI GPU spec sheet, find the row for the number format you will actually use (FP16/BF16 for training, FP8 or FP4 for inference), check whether the figure is dense or "with sparsity" (divide sparse figures by two), confirm it is per GPU rather than per server, and then weigh it against memory capacity and bandwidth, which usually decide real speed for large language models. Expect real workloads to reach roughly 35–80% of the peak number.
Step 1: pick the right row
A data-center GPU spec sheet lists a separate throughput for each number format. The rows that matter for AI are the Tensor Core rows. A row such as "FP32: 67 TFLOPS" on an H100 refers to the general-purpose CUDA cores, not the Tensor Cores, which is why it looks so small next to "FP16 Tensor Core".
| Row on the sheet | Typically used for | Unit |
|---|---|---|
| FP64 / FP64 Tensor Core | Scientific simulation | TFLOPS |
| TF32 Tensor Core | FP32 code running on Tensor Cores | TFLOPS |
| BF16 / FP16 Tensor Core | Training and high-quality inference | TFLOPS |
| FP8 Tensor Core | Fast training and inference (Hopper and later) | TFLOPS or PFLOPS |
| FP4 / FP6 Tensor Core | Inference (Blackwell, MI355X) | PFLOPS |
| INT8 Tensor Core | Quantized inference | TOPS (integer operations) |
Not sure what the formats mean? Try any number in the number format converter or read FP16, BF16, FP8 and FP4 explained.
Step 2: dense or sparse?
Since Ampere, NVIDIA spec sheets often show the "with sparsity" number first, marked with an asterisk. It assumes 2:4 structured sparsity: in every group of four weights, two are zero, and the Tensor Core skips them. Few production models are pruned this way, so the dense number is the honest one.
dense throughput = "with sparsity" throughput ÷ 2
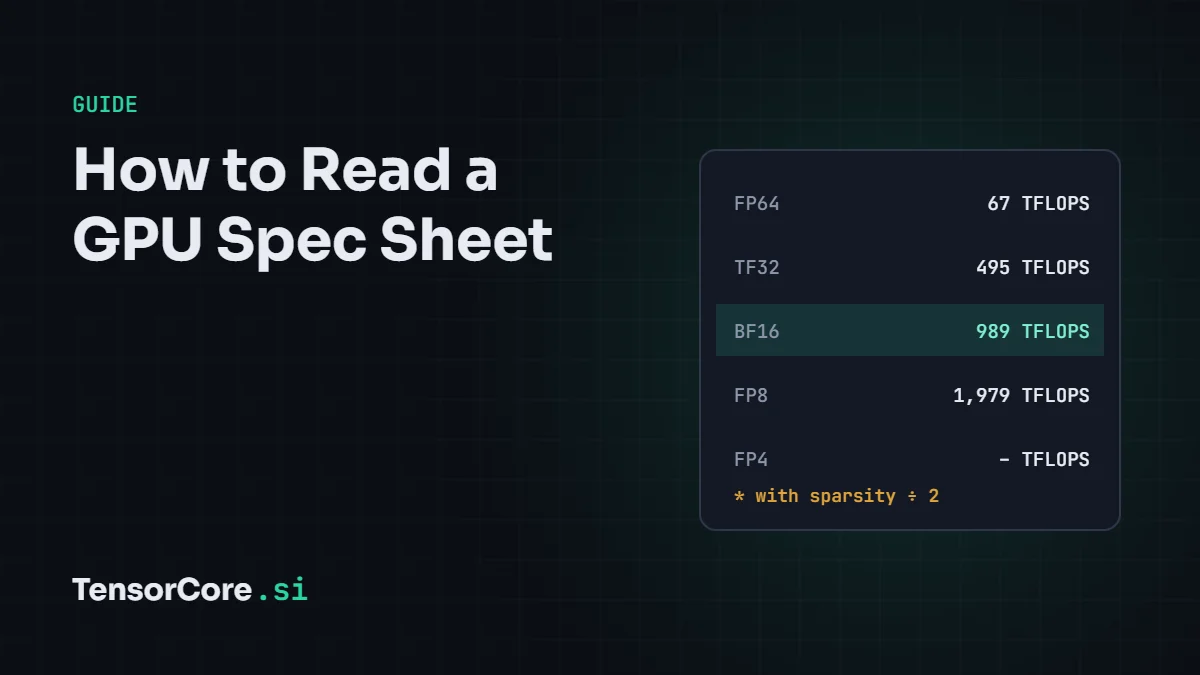
Example: the H100 SXM datasheet lists FP16 Tensor Core at 1,979 TFLOPS with sparsity, which is 989 TFLOPS dense. NVIDIA's HGX pages state the convention directly: "Specification in sparse. Dense is ½ sparse spec shown."
Step 3: per GPU, per server or per rack?
System spec sheets add up every GPU. HGX B200, an 8-GPU board, is listed at 72 PFLOPS of FP8 with sparsity. Divide by 8 GPUs and by 2 for density, and one B200 delivers 4.5 PFLOPS of dense FP8. Rack-scale systems such as GB200 NVL72 quote totals for 72 GPUs, so always check the denominator before comparing chips.
Step 4: SXM, PCIe or NVL?
The same GPU name can hide very different products. The SXM version mounts on a server baseboard with full NVLink and the highest power limit. The PCIe card fits a normal slot but runs at lower power and clocks. For example, the H100 PCIe delivers about 756 dense FP16 TFLOPS with 2 TB/s of memory bandwidth, against 989 TFLOPS and 3.35 TB/s for the H100 SXM.
Step 5: memory and bandwidth
For large language models, the two memory lines are often more important than TFLOPS:
- Capacity (GB) decides whether a model fits. A 70-billion-parameter model needs about 140 GB in FP16 or 70 GB in FP8, before the KV cache.
- Bandwidth (TB/s) caps how fast a model can generate text for a single user, because each new token reads every weight once.
A useful sanity check is the ridge point: peak FLOPS divided by bandwidth. For an H100 SXM it is about 989 ÷ 3.35 ≈ 295 FLOPs per byte. Any workload that does less math per byte than that is limited by memory, not by Tensor Cores. Read more in what is HBM.
Step 6: power and efficiency
The power figure (TDP or TBP) tells you how much the chip can draw at full load, which drives cooling and electricity costs. Divide throughput by power for a quick efficiency comparison: an H100 SXM gives about 989 ÷ 700 ≈ 1.4 dense FP16 TFLOPS per watt; a B200 gives about 2,250 ÷ 1,000 ≈ 2.25.
Where the peak number comes from
Peak Tensor Core throughput is not a measurement. It is arithmetic:
peak FLOPS = SMs × Tensor Cores per SM × FLOPs per Tensor Core per clock × boost clock
For the A100: 108 SMs × 4 Tensor Cores × 512 FP16 FLOPs per clock (256 fused multiply-adds) × 1.41 GHz ≈ 312 TFLOPS, exactly the datasheet figure. Hopper doubled the work per Tensor Core per clock to 1,024 FP16 FLOPs, which with 132 SMs at about 1.83 GHz gives the H100 SXM's 989 TFLOPS. Every halving of precision (FP16 to FP8 to FP4) doubles the FLOPs per clock again.
From peak to real performance
Real software never sustains peak. The standard measure is model FLOPs utilization (MFU): the useful math a training run achieves divided by the hardware's peak. Published large training runs typically report 35–50% MFU; Google reported 46.2% for PaLM, and Meta reported 38–43% for Llama 3 405B on H100s. A single well-tuned large matrix multiply can reach 70–80% of peak.
That lets you estimate a training run. Training compute is roughly 6 × parameters × tokens:
training time ≈ (6 × parameters × tokens) ÷ (GPUs × peak FLOPS × MFU)
A 7-billion-parameter model trained on 2 trillion tokens needs about 6 × 7×10⁹ × 2×10¹² = 8.4×10²² FLOPs. On 512 H100 GPUs at 40% MFU (512 × 989 TFLOPS × 0.4 ≈ 2×10¹⁷ FLOPS), that is about 4.2×10⁵ seconds, or just under five days.
Checklist
| Question | What to do |
|---|---|
| Is it the Tensor Core row for my format? | Use BF16/FP16 for training, FP8 or FP4 for inference |
| Is there an asterisk or "with sparsity"? | Divide by 2 |
| Is it per GPU? | Divide system figures by the number of GPUs |
| Which form factor? | SXM and PCIe versions differ in power, clocks and NVLink |
| Does the model fit? | Compare weights plus KV cache with memory capacity |
| Memory-bound or compute-bound? | Compare your FLOPs per byte with the ridge point |
| What will I really get? | Multiply peak by a realistic utilization, often 35–50% |
Frequently asked questions
What is the difference between TFLOPS and TOPS?
TFLOPS counts trillions of floating-point operations per second (FP64 down to FP4). TOPS counts trillions of integer operations per second, used for INT8 and INT4. One multiply-add counts as two operations in both.
Which number matters most for running a chatbot?
Memory capacity first (does the model fit?), then memory bandwidth (how fast tokens come out for each user), then FP8 or FP4 throughput (how many users you can serve at once).
Why do AMD and NVIDIA numbers look so different?
Both use the same conventions once you normalise for dense versus sparse and per-chip figures. AMD lists dense and sparse values separately; NVIDIA often leads with sparse. The GPU specs database puts every chip on the same dense, per-chip basis.
Put it into practice: compare chips in the GPU specs database, estimate model memory in the AI model GPU calculator, or test your instincts in Roofline Rush.



Leave a Reply